01 — Planning
Streamline financial and operational planning with a structured, scalable approach. Apliqo enables real-time forecasting, scenario modeling, and strategic planning to drive business success.
01
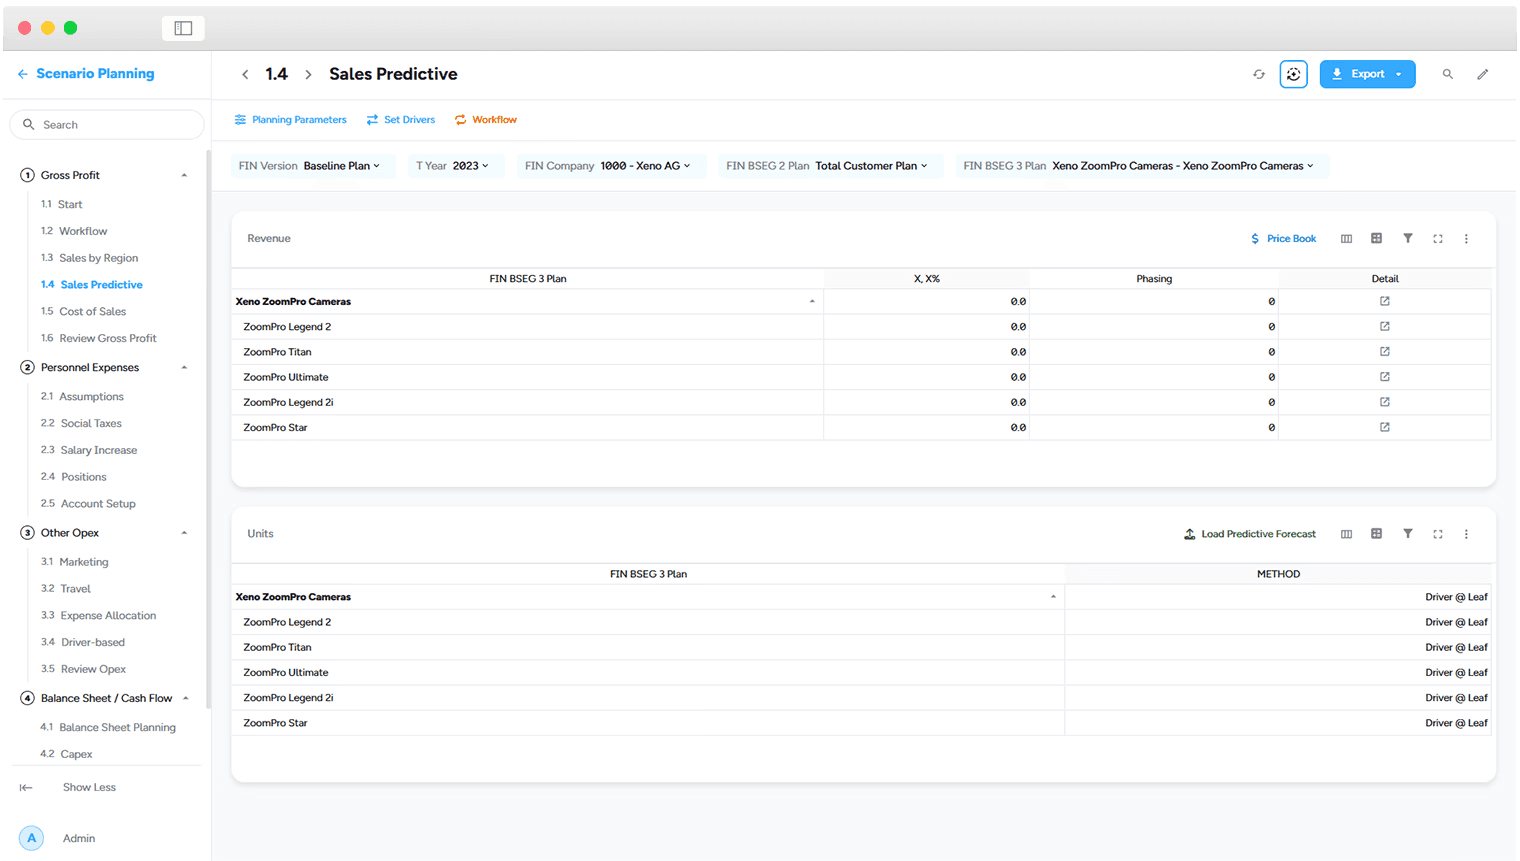
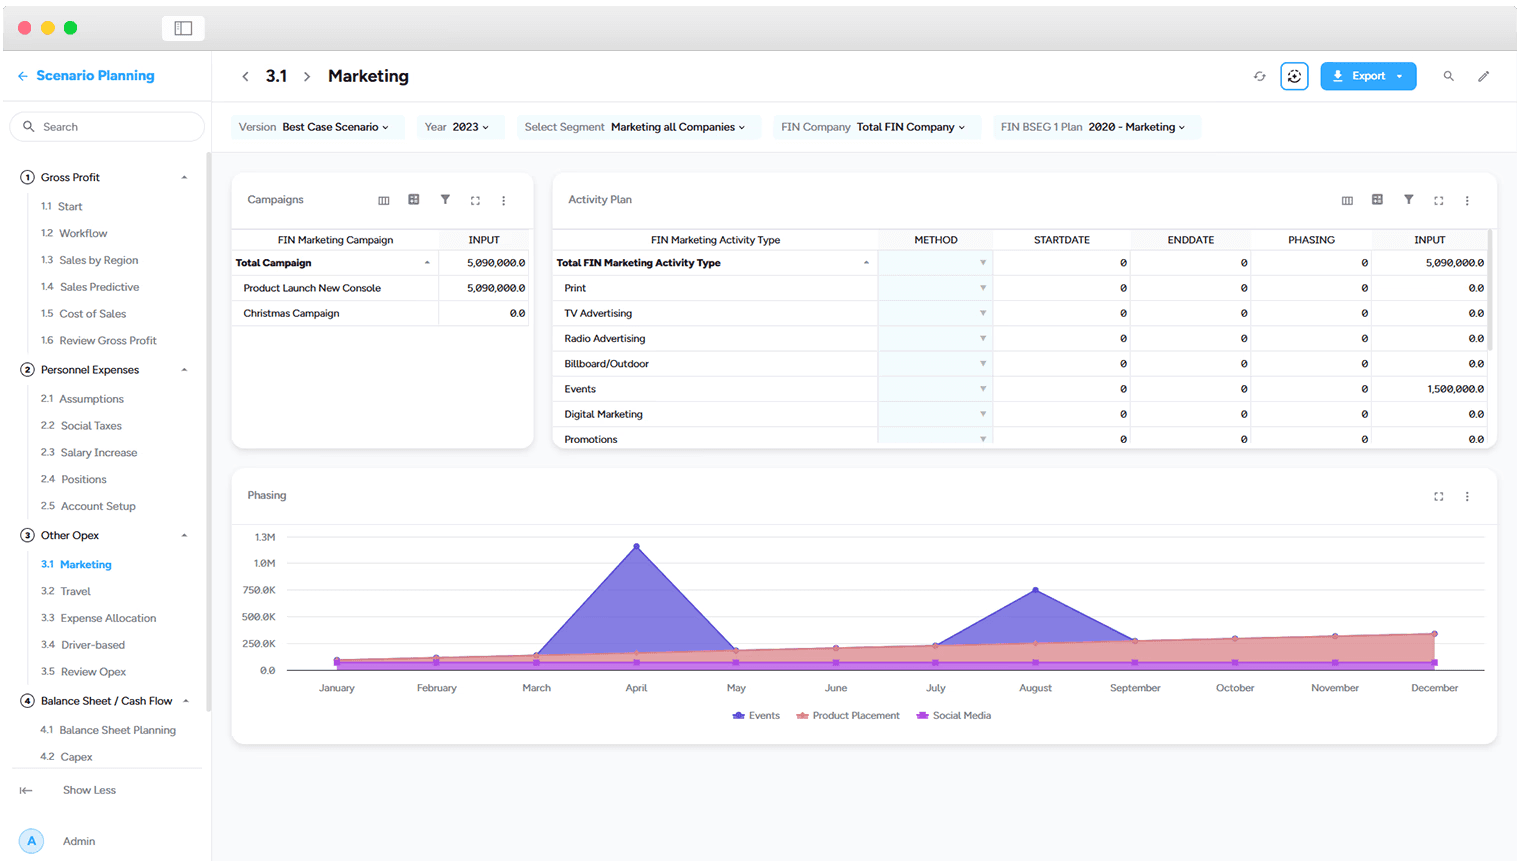
Scenario planning
Model multiple financial scenarios to manage risk and spot opportunities.
Working budget — 12-month annual plan.
Working forecast — Actuals to date plus estimates ahead.
Rolling forecast — A continuously updated projection from any start point.
Snapshot versioning — Freeze any plan for historical comparison.
02
Balance sheet planning
Link expense and revenue plans to forecast balance sheet positions with tailored drivers.
Inventories — Driven by days in inventory or % of revenue.
CapEx — Asset investments with depreciation across P&L and balance sheet.
Debt & loans — Repayment and interest forecasting.
Cash flow — Auto-calculated using the indirect method.
03
Driver based planning
Focus planning on the factors that truly move performance.
Custom drivers — Standardize drivers for revenue and cost lines.
Flexible methods — Different forecasting techniques per account or segment.
Top-down & bottom-up — Set strategic targets, refine with granular detail.
02 — Modeling
Build dynamic financial models tailored to your business needs. Apliqo’s flexible modeling capabilities allow for scenario testing, strategic decision-making, and agile business planning.
01
Workforce
Attrition Model
Predict and manage employee turnover with machine learning.
Attrition insights — Analyzes demographics, satisfaction and performance.
Proactive retention — Address risks early and allocate resources wisely.
Self-improving — Learns from new data to sharpen accuracy over time.
02
Integrated 3-way financial model
Unify financial and operational planning in one best-practice system.
Connected statements — P&L, balance sheet and cash flow in one view.
Cash flow methods — Direct and indirect, built in.
Your chart of accounts — Aligned to IFRS, GAAP or local regulations.
03
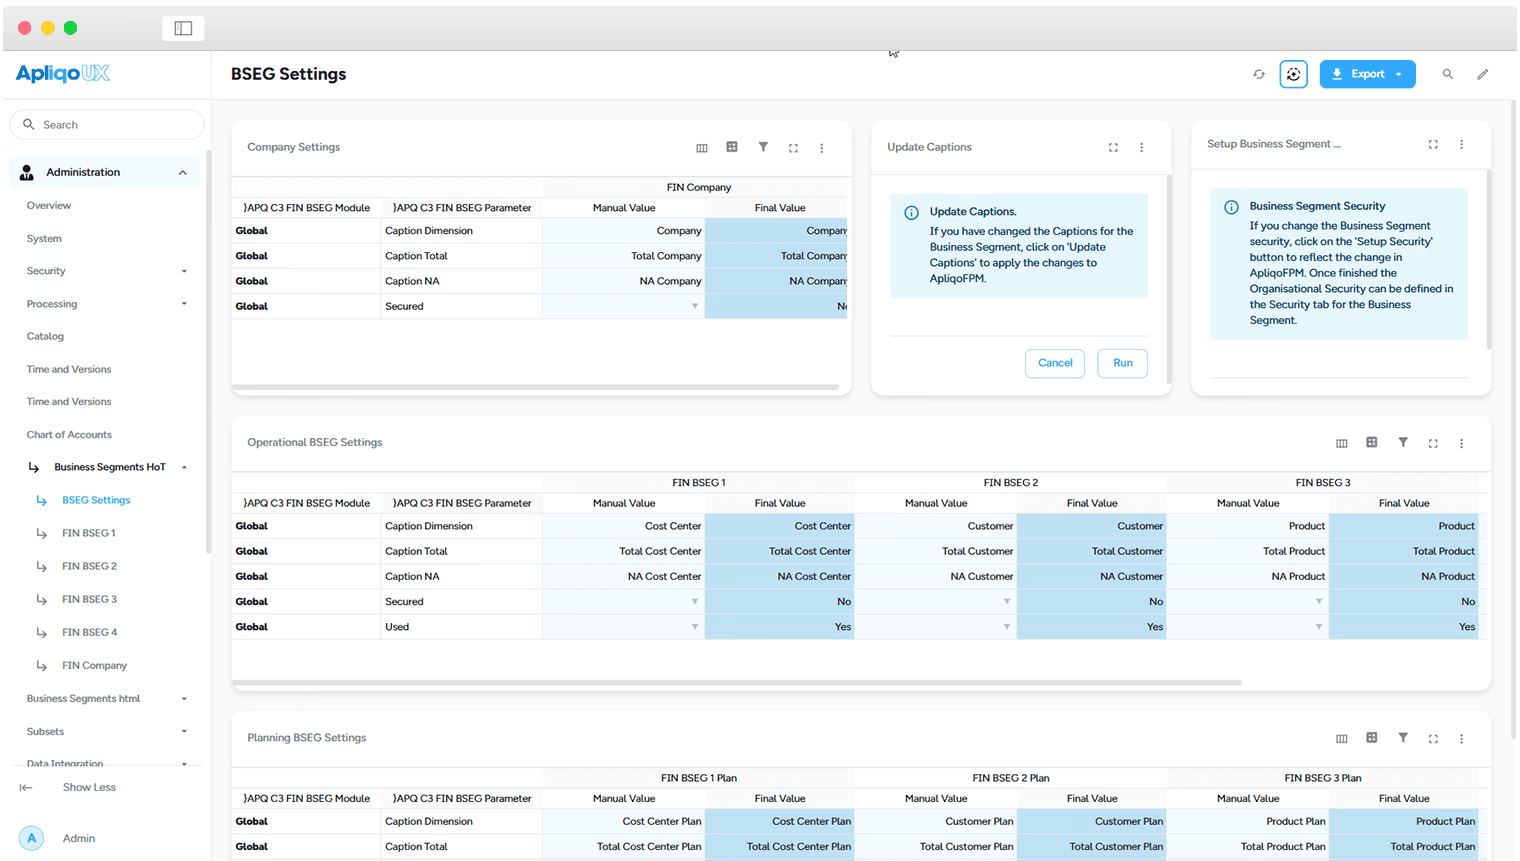
Business
Segmentation
Analyze performance across every key operational dimension.
Geographies — Compare results by region.
Products & services — Profitability at product level.
Sales channels — B2B, B2C and e-commerce.
Cost centers & divisions — Real-time expenses and budget variances.
03 — Application mode
Use finance-ready applications for planning and reporting, then tailor models, views, and rules to fit the way your organization works.
01
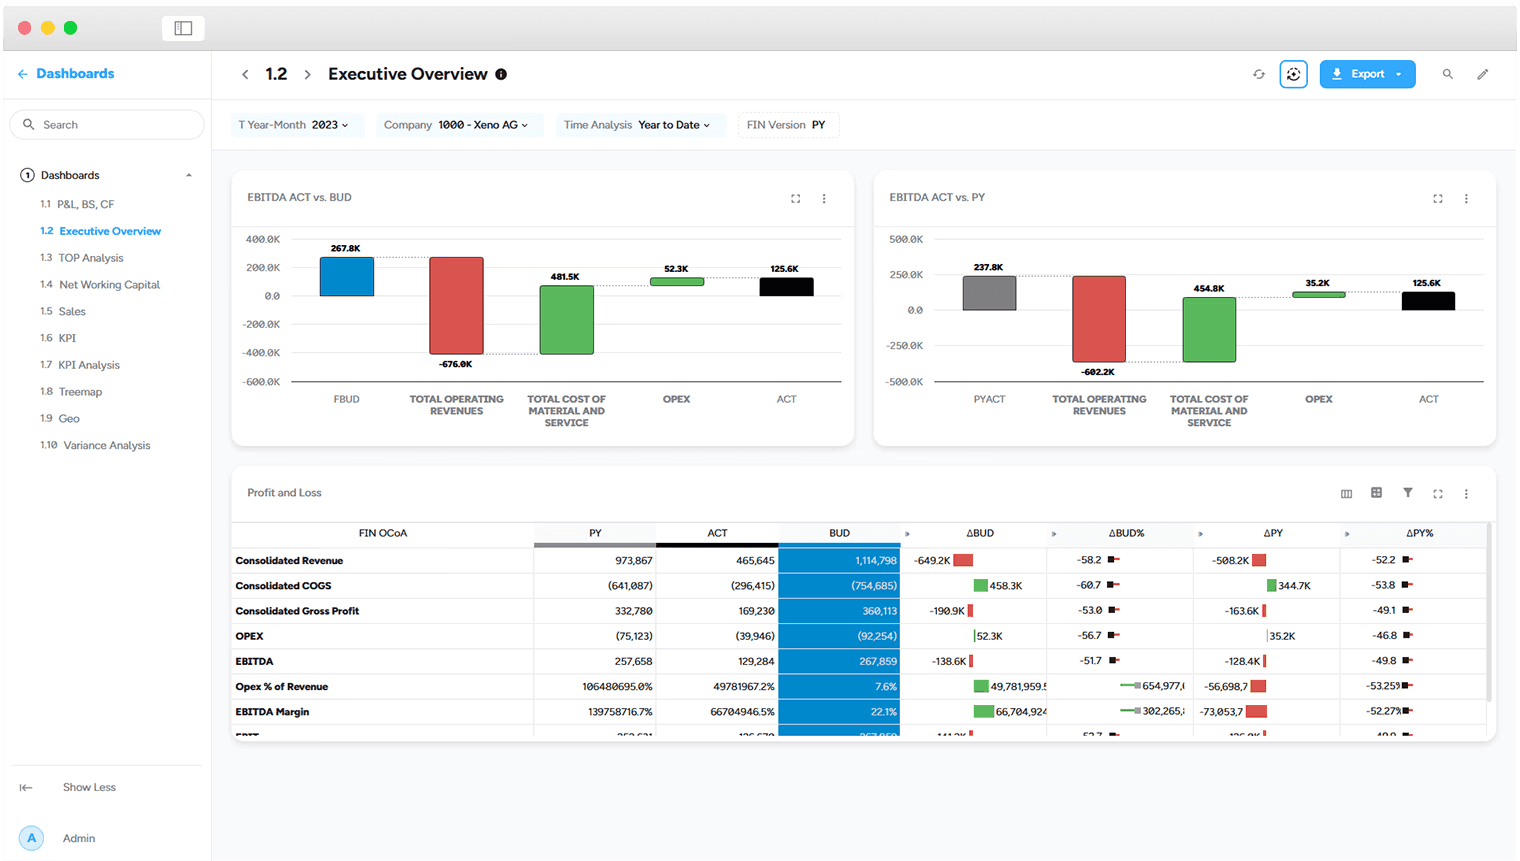
Finance-ready applications
Start with proven planning and reporting models designed around real finance processes.
02
Configurable for your business
Tailor the application to your finance team’s process and terminology.
Flexible setup — Configure forms, dimensions and views for your organization.
Finance-specific logic — Apply business rules and controls that reflect your policies.
Adaptable experience — Give each team the tools and information relevant to its role.
03
Self-service reporting
Built-in reporting and analytics let teams investigate results without waiting on IT.
Drill-down analysis — Trace performance across dimensions and uncover root causes.
Consistent visuals — Use governed KPIs and shared reporting views.
Flexible reports — Adjust parameters and share useful insights.
Publish and automate — Schedule and distribute reporting company-wide.
04 — Agent mode
Bring AI into the planning process to help teams ask questions, draft commentary, connect data, and uncover signals in financial results.
01
AI-assisted commentary
Connect leading language models to draft narrative commentary on financial results and KPIs for expert review.
02
Python and data connectivity
Extend financial analysis through Python and TM1py, connecting planning data with sources such as Salesforce, NetSuite, Google Sheets, and SAP.
03
Predictive machine learning
Use machine learning to sharpen forecasts and scenario planning.
Trend analysis — Spot patterns and anticipate performance.
Scenario testing — Explore outcomes before committing to a plan.
Learning from history — Improve forecast accuracy with historical data.
05 — Analysis mode
Explore financial performance in context. Compare actuals with plans, drill into drivers, and surface the patterns that inform what to do next.
01
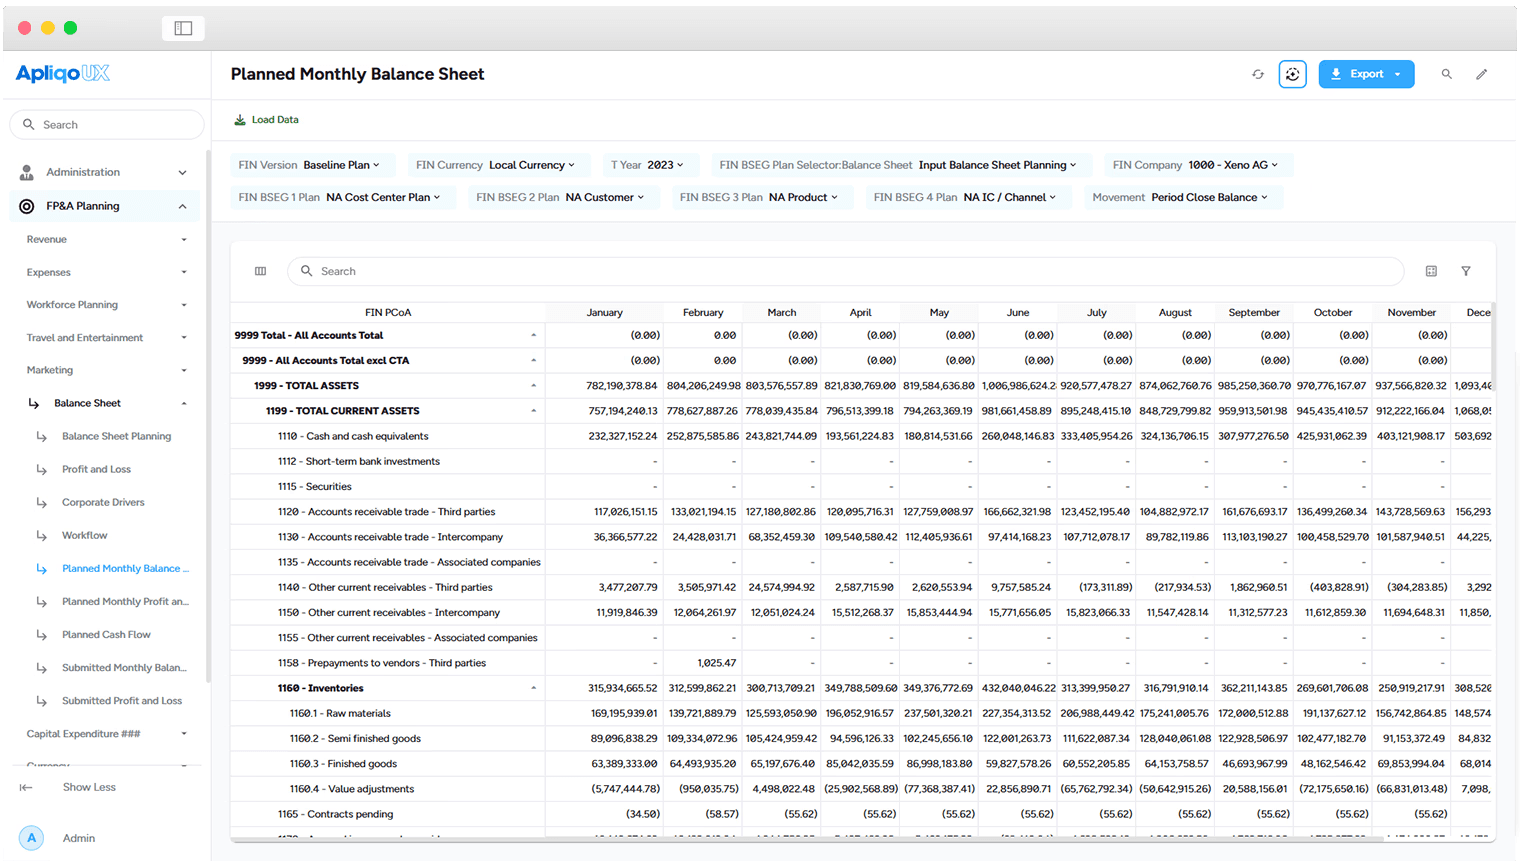
Interactive dashboards
Bring key financial KPIs and trends together in focused views that teams can explore.
02
Trace the drivers
Drill into entities, products, regions, or cost centers to understand what is shaping performance.
03
Compare scenarios
Compare actuals, plans, and forecasts to understand how performance is changing.
06 — Technology
Maintain data integrity with centralized, secure data management. Apliqo integrates multiple sources into a unified platform, ensuring accuracy, consistency, and governance across your organization.
01
External connectors for fast implementation
A growing library of out-of-the-box connectors gets you live fast.
SAP
Xero
DATEV
FinancialForce — (Salesforce)
02
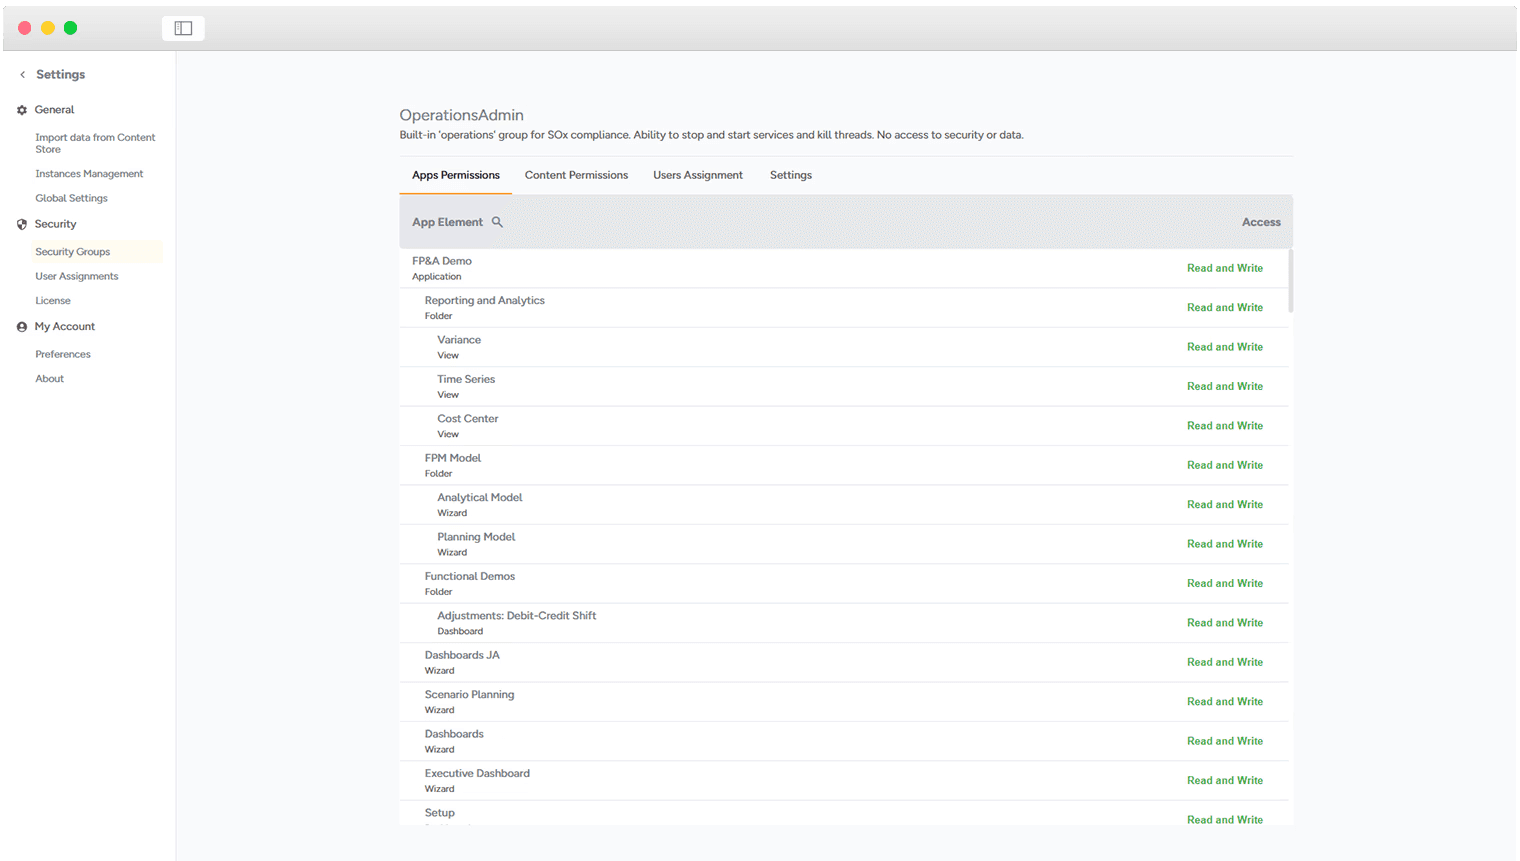
Advanced permission and access management
Granular, role-based security for every user.
Users & groups — Predefined roles to start fast.
Custom profiles — Fine-tune read/write access.
Element-level security — Restrict access to specific versions.
03
No-code report creation
A best-practice reporting model for transparency and better decisions.
KPI library — 100+ predefined KPIs, or define your own.
Variance analysis — Actuals vs. budget and other benchmarks.
Time intelligence — Quarter, half-year, annual, YTD and YTG.
Unlimited segmentation — By cost center, profit center, region and more.